Matematik
NUMBERS (link)
Number Sense (link)
Khan Academy ( link)
Place Value of Numbers (Link)
Multiplication Tables
Multiplication Tables
Time and Dates
The children will have a test on the 23rd of January, 2019. They are to revise Chapter 7 and 8 of Mattebogren 5B. They are also to read page 63 and 89. They can train on Page 153-154 (Only sums with Fractions and Percentage). Worksheets were also issued for Fractions and Percentage. They should ensure that they have certainty in solving the problems in the worksheets too.
in those worksheets.
in those worksheets.
N.B
This plan is subject to adjustment or change depending on circumstances at school.
Plan for -2019 Spring Term
|
Week
|
Class
Work
|
Homework
|
|
2
|
Intro to
Geometry Pg.126-127, 5B
|
Worksheet
|
|
3
|
Revision
Fractions and Percentage
|
Revision for
Test Fractions and Percentage
|
|
4
|
Test
(23/1-2019)Fractions and Percentage pg.135-136
(5B)
|
Pg.
128-130 (Geometry)
5B
|
|
5
|
131-132,
133-134 (Geometry)
|
Pg.140-141
(Geometry)
|
|
6
|
Pg
137-138, 139 &142(Geometry)
|
Pg
143-145 (Geometry)
|
|
7
|
146-147,
15-151(Geometry)
|
147-148
(Geometry)
|
|
8
|
Workshheet/programmering
|
Worksheet/programmering
|
|
9
|
Winter
Sport Break
|
|
|
10
|
104-105,106-107,108-108
(Vikt och volym)
|
Pg.100-103
( Vikt och volym)
|
|
11
|
110-111,
116,117-118
(Vikt och volym)
|
112-114, (Vikt och volym)
|
|
12
|
122-123,
124,
126,127
Vikt och volym
|
119-121 (Vikt och volym)
|
|
13
|
Revision
|
Revision
|
|
14
|
Test
Geometry+Vikt och volym Onsdag (3/4-2019)
|
Test
Geometry+Vikt och volym
|
|
15
|
Programming
|
Programming
|
|
16
|
Easter
|
Holidays
|
|
17
|
Temperatur och Diagram
134-135,136-137,138
|
130-133
|
|
18
|
Temperatur och Diagram
|
142-144
|
|
19
|
Temperatur och Diagram
138-139,140-141
|
145-148
|
|
20
|
Temperatur och Diagram
149, 152, 153
|
Completing unaccomplished work
|
|
21
|
Repetition/ Test
|
|
|
22
|
Programming
|
|
|
23
|
Känguru Matematik
|
There are many special symbols used in Geometry. Here is a short reference for you:
Congruent and Similar
Angles

|
|
|
 | Using Drafting Tools |  |
Transformations and Symmetry

Coordinates
W
|
Week
|
Class
Work
|
Homework
|
35
|
9-10, 11-12, 13-14 Tal (Number
Sense)
|
16-18 Tal (Number Sense)
|
36
|
19-20, 22-23,29-29 Tal (Number
Sense)
|
24-27 Tal (Number Sense)
|
37
|
30-31, 32-33, 38-39 (Tal)
|
34-36 Tal (Number Sense)
|
38
|
74-75, 80-81, 82-83( Decimal Tal)
|
76-79 (Decimal Tal)
|
39
|
84-85, 86-89,92-93 (Decimal Tal)
|
Page 88-91 (Decimal Tal)
|
40
|
14,15,16,17,18,19( Tal)
|
Page 27-30
|
41
|
31-32, 33&36, 37 (Decimal Tal 5B)
|
94-97 (Decimal Tal 5B)
|
42
|
98-99,104-105,106& and 108(Decimal Tal 5B)
|
100-103(Decimal Tal 5B)
|
43
|
112-113,114-115, 116-117(Decimal Tal 5B)
|
108-111(Decimal Tal 5B)
|
44
|
||
45
|
120 122 and 123
|
Revision
|
46
|
Repetition
Test
Programming
(Page 44-45, 46-47, 48-49) Fractions)
|
Valfrit code .org eller scratch
Page 40
-43
(Fractions)
|
47
|
Pg.50-51, 58-61 (Fractions)
|
Pg 53-56 (Fractions)
|
48
|
Page 62& 64-65 F Fractions)
|
68-70 (Percentage)
|
49
|
71-72, 73-74, 75-76 (Percentage)
|
77-80 (Percentage)
|
50
|
81-82, 83-84,90-91 (Percentage)
|
86-88 (Percentage)
|
51
|
Programming
|
Programming
|
52
|
||
Week
|
Class Work
|
Homework
|
35
|
9-10, 11-12, 13-14 Tal (Number
Sense)
|
16-18 Tal (Number Sense)
|
36
|
19-20, 22-23,29-29 Tal (Number
Sense)
|
24-27 Tal (Number Sense)
|
37
|
30-31, 32-33, 38-39 (Tal)
|
34-36 Tal (Number Sense)
|
38
|
74-75, 80-81, 82-83( Decimal Tal)
|
76-79 (Decimal Tal)
|
39
|
84-85, 86-89,92-93 (Decimal Tal)
|
Page 88-91 (Decimal Tal)
|
40
|
14,15,16,17,18,19( Tal)
|
Page 27-30
|
41
|
31-32, 33&36, 37 (Decimal Tal 5B)
|
94-97 (Decimal Tal 5B)
|
42
|
98-99,104-105,106& and 108(Decimal Tal 5B)
|
100-103(Decimal Tal 5B)
|
43
|
112-113,114-115, 116-117(Decimal Tal 5B)
|
108-111(Decimal Tal 5B)
|
44
|
||
45
|
120 122 and 123
|
Revision
|
46
|
Repetition Test
|
|
47
|
||
48
|
||
49
|
||
50
|
||
51
|
||
52
|
||
Update plan for Mathematics
Week
|
Class Work
|
Class Work
|
Homework
|
2
|
106-107 (M&D)
|
108 and 113
(M&D)
|
Page
110-112(M&D)
|
3
|
114-115(M&D)
|
121-123 (M&D) 4A
|
Page
116-119(M&D)
|
4
|
124-125
4A
(M&D) |
130-134 M&D
4A
(M&D) |
Page
128-129 4A
(M&D)
|
5
|
122-123 4b(M&D)
|
126-127 4b(M&D)
|
Page 128-129 4b
(M&D)
|
6
|
134-135 4b M&D
|
141-143 4b(M&D)
|
Page 138-140 4b
|
7
|
136-137 4a
statistics
|
142-144 4a
statistics |
Page 138-141 4a
statistics |
8
|
145-147 4a
statistics |
155-157 4a
statistics |
148-150 4a
statistics |
9
|
|||
10
|
151-152
Statistics 4a |
153 Revision
|
Revision
(M&D) and statistics
|
11
|
Revision/ Intro Time
|
Test M&D +Statistics
|
10-144b Time
|
12
|
8-9,15-16
4b Time
|
17-18, 24-25 4b Time
|
21-23 4b
Time
|
13
|
26-27, 30&324b Time
|
33 Revision Time
|
27-29 4b Time
|
14
|
|||
15
|
Fractions 4b
94-96,97-99 |
Fractions 4b
104-106 |
Fractions 4b
100-103 |
16
|
Fractions 4b
108-109, |
Fractions 4b
114-115 |
Fractions 4b
110-112 |
17
|
Fractions 4b
113 and 116 |
Fractions 4b
118-119 |
Fractions 4b
148-149 |
18
|
Fractions 4b
Revision |
Fractions 4b
Revision |
Fractions 4b
Revision |
19
|
Revision
|
Test (Time and Fractions) on 3rd May.
|
|
20
|
Geometry 4b
Angles,enlargement,scale 68-69, 74-75 |
|
Geometry 4b
Angles, enlargement, scale
pg 70-73 |
||
21
|
Geometry 4b
Angles, enlargement, scale
84-85, 86-87
|
Geometry 4b
Angles, enlargement, scale
88
|
Geometry 4b
Angles, enlargement, scale
80-83 |
||
22
|
Geometry 4b
Angles, enlargement, scale 89-90 |
Page 135-140 |
4b
141-144 |
||
23
|
Revision
|
Revision
End of Term |
Revision
End Of Term |
||
23
|
|||||
Week
|
Class Work
|
Class Work
|
Homework
|
2
|
106-107 (M&D)
|
108 and 113 (M&D)
|
Page 110-112(M&D)
|
3
|
114-115(M&D)
|
121-123 (M&D) 4A
|
Page 116-119(M&D)
|
4
|
124-125 4A
(M&D) |
130-134 M&D 4A
(M&D) |
Page 128-129 4A
(M&D)
|
5
|
122-123 4b(M&D)
|
126-127 4b(M&D)
|
Page 128-129 4b (M&D)
|
6
|
134-135 4b M&D
|
141-143 4b(M&D)
|
Page 138-140 4b
|
7
|
136-137 4a statistics
|
142-144 4a
statistics |
Page 138-141 4a
statistics |
8
|
145-147 4a
statistics |
155-157 4a
statistics |
148-150 4a
statistics |
9
|
Qualitative vs Quantitative
Data can be qualitative or quantitative.- Qualitative data is descriptive information (it describes something)
- Quantitative data is numerical information (numbers)

Bar Graphs
A Bar Graph (also called Bar Chart) is a graphical display of data using bars of different heights.
Imagine you just did a survey of your friends to find which kind of movie they liked best:
| Table: Favorite Type of Movie | ||||
| Comedy | Action | Romance | Drama | SciFi |
|---|---|---|---|---|
| 4 | 5 | 6 | 1 | 4 |
We can show that on a bar graph like this:

It is a really good way to show relative sizes: we can see which types of movie are most liked, and which are least liked, at a glance.
We can use bar graphs to show the relative sizes of many things, such as what type of car people have, how many customers a shop has on different days and so on.
We can use bar graphs to show the relative sizes of many things, such as what type of car people have, how many customers a shop has on different days and so on.
Example: Nicest Fruit
A survey of 145 people asked them "Which is the nicest fruit?":| Fruit: | Apple | Orange | Banana | Kiwifruit | Blueberry | Grapes |
| People: | 35 | 30 | 10 | 25 | 40 | 5 |

Bar Graphs can also be Horizontal, like this:

Example: Student Grades
In a recent test, this many students got these grades:| Grade: | A | B | C | D |
| Students: | 4 | 12 | 10 | 2 |

Histograms vs Bar Graphs

Bar Graphs are good when your data is in categories (such as "Comedy", "Drama", etc).
But when you have continuous data (such as a person's height) then use a Histogram.
It is best to leave gaps between the bars of a Bar Graph, so it doesn't look like a Histogram.
But when you have continuous data (such as a person's height) then use a Histogram.
It is best to leave gaps between the bars of a Bar Graph, so it doesn't look like a Histogram.
Line Graph: a graph that shows information that is connected in some way (such as change over time)
You are learning facts about dogs, and each day you do a short test to see how good you are. These are the results:
And here is the same data as a Line Graph:

Or you can draw it yourself!
Let's make the vertical scale go from $0 to $800, with tick marks every $200
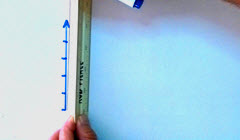
Draw a vertical scale with tick marks
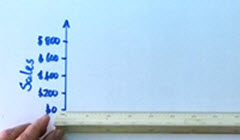
Label the tick marks, and give the scale a label
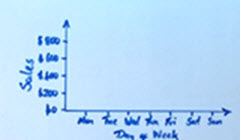
Draw a horizontal scale with tick marks and labels
Put a dot for each data value
Connect the dots and give the graph a title
Important! Make sure to have:
You are learning facts about dogs, and each day you do a short test to see how good you are. These are the results:
| Table: Facts I got Correct | |||
| Day 1 | Day 2 | Day 3 | Day 4 |
|---|---|---|---|
| 3 | 4 | 12 | 15 |
You seem to be improving!
Making Line Graphs
You can create graphs like that using the Data Graphs (Bar, Line and Pie) page.Or you can draw it yourself!
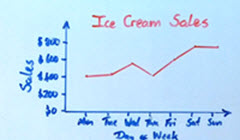
Example: Ice Cream Sales
| Table: Ice Cream Sales | ||||||
| Mon | Tue | Wed | Thu | Fri | Sat | Sun |
|---|---|---|---|---|---|---|
| $410 | $440 | $550 | $420 | $610 | $790 | $770 |
Draw a vertical scale with tick marks
Label the tick marks, and give the scale a label
Draw a horizontal scale with tick marks and labels
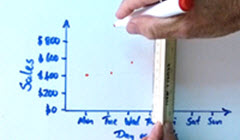
Put a dot for each data value
Connect the dots and give the graph a title
- A Title
- Vertical scale with tick marks and labels
- Horizontal scale with tick marks and labels
- Data points connected by lines
Frequency
Frequency is how often something occurs.
Example: Sam played football on:
- Saturday Morning,
- Saturday Afternoon
- Thursday Afternoon
Frequency Distribution
By counting frequencies we can make a Frequency Distribution table.
This is the definition:Example: Goals
Sam's team has scored the following numbers of goals in recent games
2, 3, 1, 2, 1, 3, 2, 3, 4, 5, 4, 2, 2, 3Sam put the numbers in order, then added up:

- how often 1 occurs (2 times),
- how often 2 occurs (5 times),
- etc,
From the table we can see interesting things such as
- getting 2 goals happens most often
- only once did they get 5 goals
Frequency Distribution: values and their frequency (how often each value occurs).Here is another example:
Example: Newspapers
These are the numbers of newspapers sold at a local shop over the last 10 days:
22, 20, 18, 23, 20, 25, 22, 20, 18, 20Let us count how many of each number there is:
It is also possible to group the values. Here they are grouped in 5s:Papers Sold Frequency 18 2 19 0 20 4 21 0 22 2 23 1 24 0 25 1
(Learn more about Grouped Frequency Distributions)Papers Sold Frequency 15-19 2 20-24 7 25-29 1 Graphs
After creating a Frequency Distribution table you might like to make a Bar Graph or a Pie Chart using the Data Graphs (Bar, Line and Pie) page.
För kommande Veckor
Klockor ser vi överallt. Klockor bestämmer när vi måste lägga oss, när nästa lektion börjar och när skoldagen är slut.
Detta är mycket bra att öva på:
- 1 år = 52 veckor
- 1 år = 12 månader
- 1 år = 365 dagar
- 1 kvartal = 3 månader
- 1 vecka = 7 dagar
- 1 dag = 24 timmar
- 1 timme = 60 minuter
När du är klar med geometri ska du
- Känna till något om hur man mätte sträcker förr
- Kunna mätta och rita sträckor
- Kunna uppskatta och mäta längd
- Kunna växla mellan olika längdenheter
- Känna till egenskaper och namnet på några geometriska objekt
- Kunna rita rektanglar med givna mått
- Kunna räkna ut figurers omkrets
Detta är mycket bra att öva på:
- 1 meter = 10 decimeter
- 1 decimeter = 10 centimeter
- 1 centimeter = 10 millimeter
För längre avstånd använder vi
1 kilometer = 1000 meter (kom ihåg att kilo betyder tusen)
1 mil = 10 kilometer
1 kilometer = 1000 meter (kom ihåg att kilo betyder tusen)
1 mil = 10 kilometer
Volymer mäter vi oftast i liter. En vanlig vattenflaska kan innehålla ungefär en liter och en stor läskflaska innehåller ungefär en och en halv liter.
För mindre volymer (som en tekopp eller en liten ask) använder vi enheterna deciliter, centiliter och milliliter. De förkortas dl, cl och ml.
- 1 l = 10 dl
- 1 dl = 10 cl
- 1 cl = 10 ml
Kubikdecimeter är ett annat ord för liter men är inte lika vanligt i vardagen.
Skriv i milliliter (ml): 3 deciliter (dl) och 5 centiliter (cl).
Svar: 350 milliliter
Begrepp
SträckaMeter
Centimeter
Millimeter
Kub
Kon
Cylinder
Tetraeder
Pyramid
Sida
sidoyta
Hörn
Kant
Längd
Bredd
omkrets
Line and Angle Terms :
A figure that is formed when two rays meet at a common endpoint.
where A is the common endpoint of the two rays.
An angle can also be represented by three letters with the middle letter the common endpoint of the two rays and the first and last letters as points on each of the rays.
For example: is angle A, is
Acute angle:
An angle whose measure is less than 90-degrees,
or right angle.
Obtuse angle: An angle whose measure is greater than 90-degrees,
or a right angle.
Right angle: An angle whose measure is exactly 90-degrees.
Straight angle: An angle whose measure is 180-degrees, which forms a straight line.
Rotational symmetry: A term describing a shape that remains unchanged when it is turned less than 360-degrees about a fixed Point
Square and Rectangle Terms :
Square :A closed figure with four equal sides and four equal (right) angles.
Rectangle: A closed figure with four sides, whose opposite sides are equal and with four equal (right) angles. Right angle: An angle whose measure is exactly 90-degrees.
Similar shapes:
Two shapes that have the exact same shape—corresponding angles that are congruent and corresponding sides that are proportional.
Congruence:
The relationship between two geometric shapes having the same size and shape (congruent shapes).
Quadrilateral Terms :
Any four-sided, closed figure.
Trapezoid: A quadrilateral with exactly one pair of parallel sides.
Parallelogram: A quadrilateral with opposite sides that are equal and parallel.
Rhombus: A parallelogram with four congruent sides.
Square: An equilateral and equiangular quadrilateral. (OR: A closed figure with four equal sides and four equal (right) angles.) Rectangle: A quadrilateral with all interior right angles.
Pyramid Terms :
A simple, closed, three-dimensional shape formed by plane polygons.
Pyramid: A polyhedron that has one base and a set of edges that meet at a single point (apex) that is not in the base; all faces except the base MUST be a triangle; the base MAY be a triangle.
Triangular pyramid: A pyramid with a triangular base.
Square pyramid: A pyramid with a square base.
Vertex: The point where two rays forming an angle meet; the point where two sides of a polygon meet; or the point where three or more faces of a polygon meet.
Vertices: Plural of vertex.
Edge: The line of a three-dimensional shape where two plane faces meet. Face:
One of the plane surfaces of a polyhedron bounded by edges. Base: The side of a shape used as its foundation; the face of a solid used as its foundation.
Apex: The point, off the base of a pyramid, where the triangular faces meet.
Net: A pattern that can be cut out, folded and glued together to make a three-dimensional model of a solid Point
More 2-D Shapes Polygon:
A simple closed shape composed of a finite number of line segments, each of which intersects exactly two of the other segments, one at each endpoint.
Pentagon:
A polygon with five sides. Regular pentagon: A polygon with five congruent sides and five congruent angles.
Hexagon:
A polygon with six sides. Regular hexagon: A polygon with six congruent sides and six congruent angles.
Octagon:
A polygon of eight sides. Regular octagon: A polygon of eight congruent sides and eight congruent angles.
More 3-D Shapes Polyhedron:
A simple, closed, three-dimensional shape formed by plane polygons.
Cube:
A rectangular polyhedron composed of six congruent squares.
Triangular prism:
A polyhedron that has two congruent parallel triangular faces and a set of parallel edges that connect corresponding vertices of these two triangular faces.
Vertex: The point where two rays forming an angle meet; the point where two sides of a polygon meet; or the point where three or more faces of a polygon meet.
Vertices: Plural of vertex.
Edge: The line of a three-dimensional shape where two plane faces meet.
Pattern: A way that things are arranged so that whatever comes next can be predicted.
Fraction: Part of a whole, or part of a set. It can be expressed as a rational number over a rational number.
For example: 1/4. Equivalent fraction:
Different ways of naming the same fraction.
For example: 4/8 and 2/4 are both equivalent to 1/2.
Midpoint: A point that divides a line segment into two congruent line segments.
Arbetsätt
Tillverka egna linjalen
Arbeta par/grupp
Rita gemetriska figurer
Beskriva formerna kvadrat, rektangel, cirkel
kub, tetraeder, pyramid, klot, cylinder och kon
Beräkna area och omkrets
Under Constrction!
Homework week 35
Matte Borgen 4A page 13-15. To be handed in on Friday week 35.
Problemlösning
Du ska:
- förstå frågan i en textuppgift
- använda olika strategier när du löser ett problem
- tolka dina resultat och dra en slutsats
- avgöra om ett svar är rimligt
- lösa problem själv
- lösa problem i grupp
Begrepp
Du ska:- använda begreppen
- beskriva begreppen
- använda olika uttrycksformer för att beskriva begrepp
- beskriva olika uttrycksformer för att beskriva begrepp
- beskriva likheter och skillnader mellan begrepp
- visa samband mellan begrepp
Methoder
Du ska - :använda en skriftlig räknemetod som passar till uppgiften
- välja och använda den metod som passar bäst för den uppgiften
- använda en huvudräkningsmetod som är snabb och enkel
- och använda passande räknesätt i en problemlösningsuppgift
- använda miniräknare
Du ska :
- ställa och besvara frågor i grupp
- motivera din lösning skriftligt
- motivera din lösning muntligt
- följa andra elevers förklaringar och bidra med ideer om hur en uppgift
- kan lösas
- första andra elevers förklaringar och bidra med egna ideer
Du ska:
- förklara vad som menas med olika begrepp
- berätta för en kamrat hur du har löst en uppgift
- redovisa dina uppgifter skriftligt så någon annan förstår vad
- du menar
- lyssna på en kamrats förklaring hur den e löst en uppgift
- visa min lösning med bild och / eller symboler
Inga kommentarer:
Skicka en kommentar